What it is
Multidimensional Linear Performance Pricing
Price regression analysis, also known as "Multidimensional Linear Performance Pricing", analyses the correlation between the price and any other characteristics of the investigated products.
As a result, it delivers a linear approximation of the "expected price" or "technical value". Effectively, it performs a price comparison that reflects the incorporated characteristics of the product.
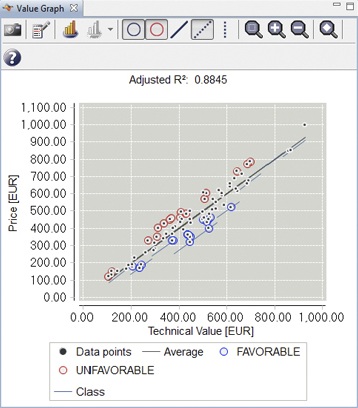
The "value graph" is a graphical comparison of the actual price (on the vertical axis) and the technical value (on the horizontal axis). One glance suffices to identify the expensive products above the line and the cheaper products below the line.
Where it applies
Broad range of similar products
The application of price regression analysis is particularly valuable for products — materials, parts, services — that are available in a broad range of similar, but not identical varieties.
Most valuable for comparison across
- Different suppliers for the same product category
- Products sourced from different regions or countries
- Prices across various sites within your organisation
- Predecessor and successor products over time
The value graph
One glance. Full picture.
The value graph plots actual price (vertical axis) against technical value (horizontal axis). The regression line represents the expected price — products above are expensive, products below are cheaper.